The meticulous documentation of an engineering lab experiment is paramount for ensuring reproducibility, analysis, and ultimately, the advancement of scientific knowledge. A well-structured engineering lab report template provides a clear and consistent framework for capturing all essential data, observations, and conclusions. It's more than just a document; it's a crucial tool for collaboration, peer review, and the continuous improvement of experimental practices. This article will delve into the key components of a robust engineering lab report template, offering practical guidance and best practices for creating effective reports. Understanding and utilizing this template effectively is essential for any engineer, scientist, or technician involved in laboratory work. The core purpose is to facilitate clear communication of experimental results, minimizing ambiguity and maximizing the value of the research. Let's explore how to build a template that truly serves your needs.
Understanding the Importance of a Lab Report Template
Before diving into the specific sections, it's vital to appreciate why a dedicated template is so valuable. Lab reports aren't simply a summary of what happened; they're a narrative of the process, a record of the data collected, and a reasoned explanation of the findings. A template ensures that all critical elements are addressed, promoting objectivity and reducing the potential for misinterpretation. Furthermore, standardized formatting facilitates consistent reporting across different labs and teams, streamlining the review process. The benefits extend beyond simple documentation; they contribute to a culture of rigorous scientific inquiry. A well-crafted template empowers researchers to focus on the core of their work – the data – rather than getting bogged down in administrative details. Consider the implications of a poorly formatted report – it can be difficult to locate specific data, leading to confusion and potentially flawed conclusions.
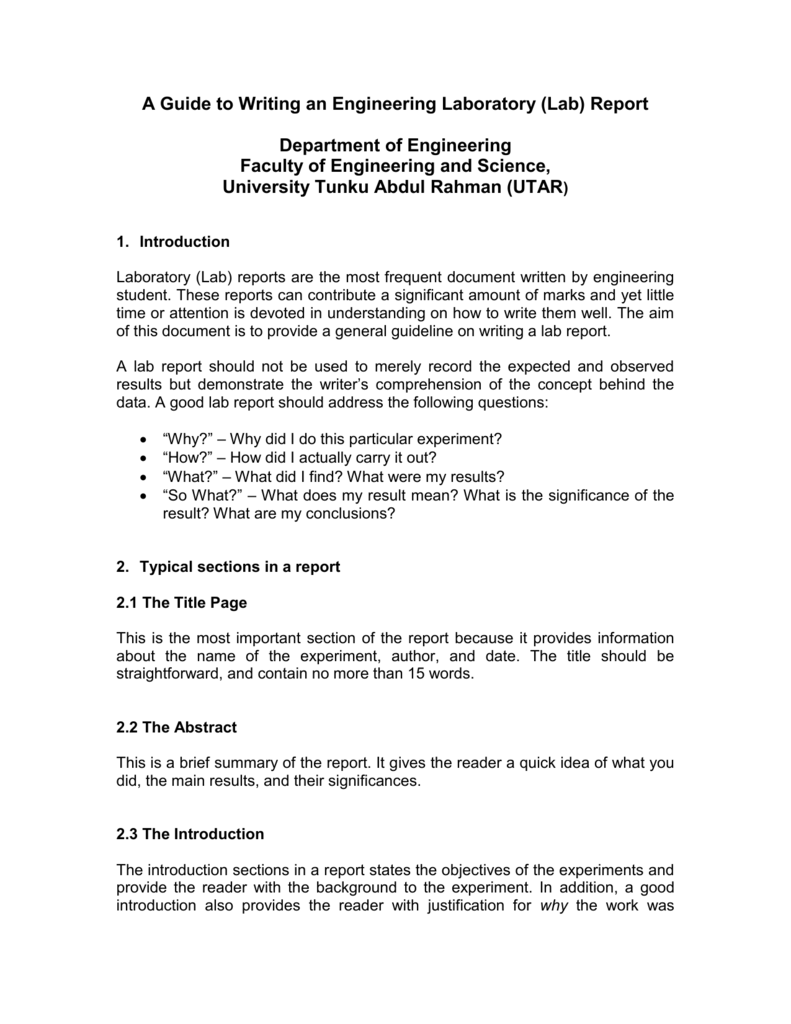
Section 1: Introduction – Setting the Stage
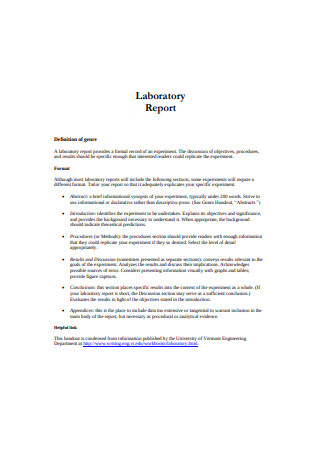
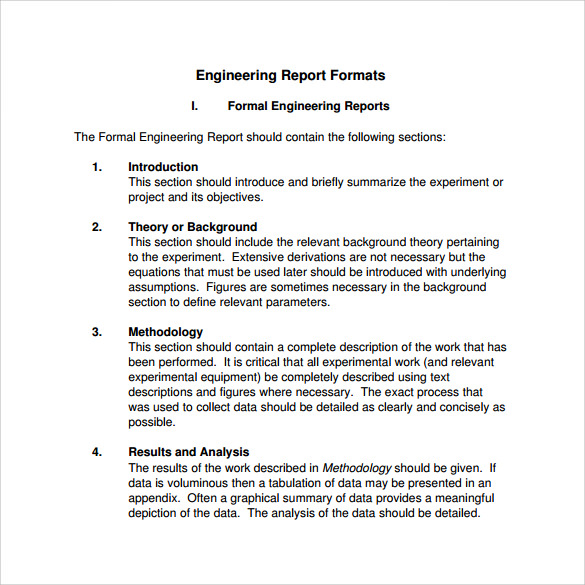
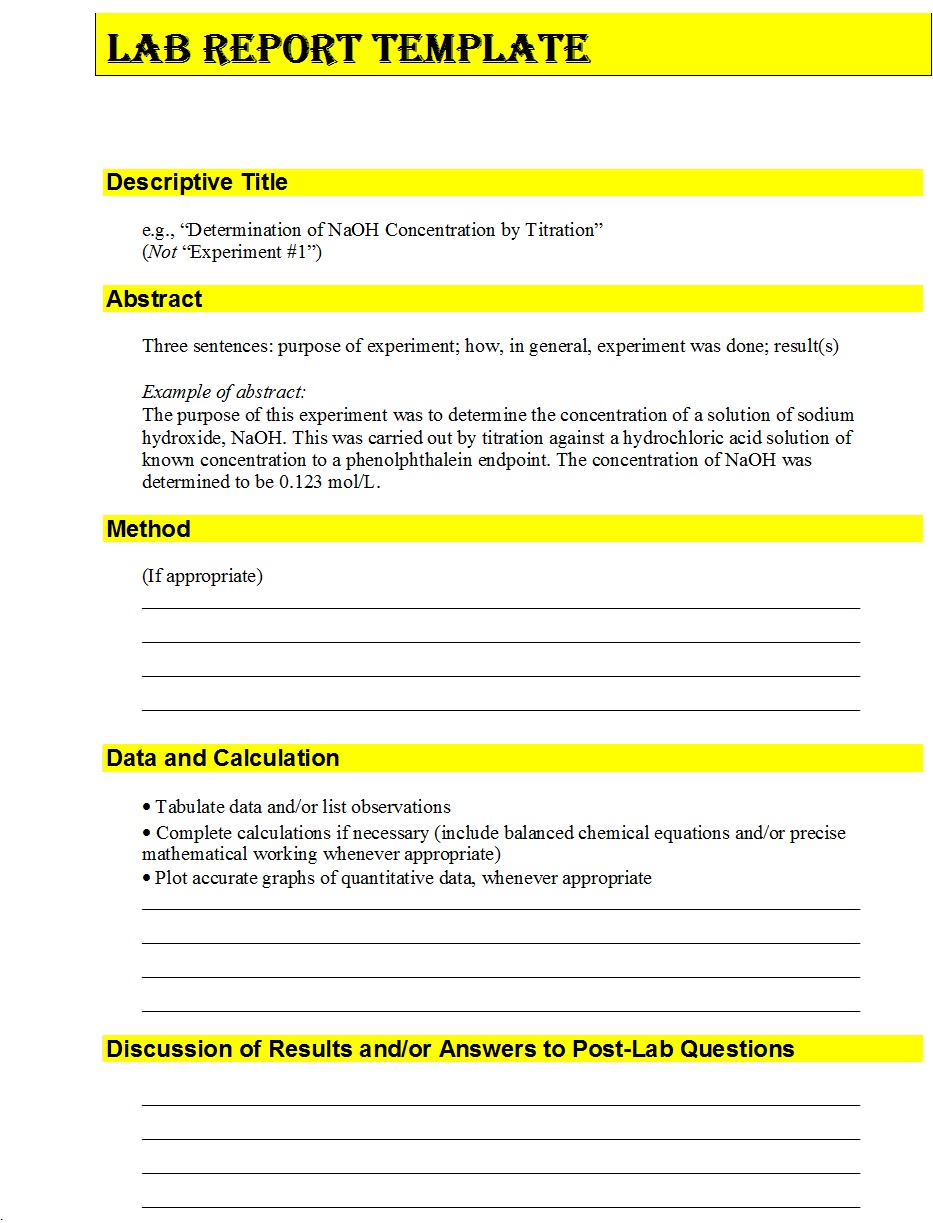
The introduction to a lab report serves as a crucial gateway, immediately establishing the context and purpose of the experiment. It's your opportunity to capture the reader's attention and clearly articulate why this particular experiment is important. A strong introduction typically includes:
- Brief Overview of the Experiment: A concise description of the experimental setup, including the materials used and the overall objective. For example, "This experiment investigated the effect of varying concentrations of acid on the rate of corrosion of steel."
- Problem Statement: Clearly state the problem or question the experiment was designed to address. This demonstrates an understanding of the underlying scientific principle. "The objective of this experiment was to determine the corrosion rate of steel exposed to different acid concentrations."
- Hypothesis (if applicable): If a hypothesis was formulated, state it clearly. "It was hypothesized that increasing the concentration of acid would accelerate the corrosion rate of steel."
- Brief Overview of Methods: A very short summary of the experimental procedure. "The experiment involved immersing steel samples in varying concentrations of hydrochloric acid (1%, 5%, and 10%) for 24 hours."
Key takeaway: The introduction needs to be engaging and immediately establish the relevance of the experiment. It's the foundation upon which the entire report will be built. Engineering Lab Report Template – this section is the starting point for a comprehensive and well-structured report.
Section 2: Materials and Methods – The Blueprint of the Experiment
This section meticulously details how the experiment was conducted. It's a crucial section for reproducibility, as it allows others to replicate the experiment and verify the results. Include the following:

- Materials List: A complete list of all materials used, including quantities and specifications. "Steel samples (100g), hydrochloric acid (37%), distilled water, pH meter, stopwatch."
- Equipment List: A list of all equipment used, including model numbers and calibration dates. "pH meter (model 210), stopwatch, graduated cylinders, beakers, stirring rods."
- Procedure: A detailed, step-by-step description of the experimental procedure. Use clear and concise language, avoiding jargon where possible. "Steel samples were submerged in each of the three acid solutions (1%, 5%, and 10%) for 24 hours. The pH of each sample was measured every hour using a calibrated pH meter. The rate of corrosion was calculated as the change in pH over time."
- Control Group (if applicable): Describe any control groups used and their purpose. "A control group of steel samples was maintained in distilled water without acid exposure."
Important Note: Provide sufficient detail so that someone could theoretically repeat the experiment exactly. Don't assume the reader has prior knowledge of the equipment or procedures.

Section 3: Results – Presenting the Data
This section presents the data collected during the experiment. It's where you visually represent your findings. Common methods include:
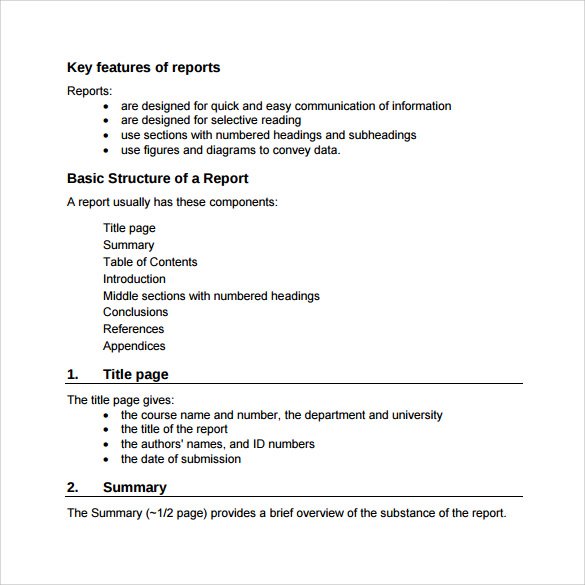
- Tables: Organize data in tables, clearly labeling each column with relevant information. "Acid Concentration | Time (hours) | pH Change"
- Graphs: Use graphs (bar graphs, line graphs, etc.) to visually represent trends and patterns. "pH Change vs. Time"
- Charts: Use charts to summarize key data points. "Average pH Change over Time"
Key Considerations:
- Units: Always include units of measurement. "pH values were measured in millimoles per liter (mmol/L)."
- Clear Labeling: Clearly label all axes, columns, and graphs.
- Significant Figures: Indicate the number of significant figures in your measurements.
Section 4: Discussion – Interpreting the Results
This is arguably the most important section, where you analyze your results and draw conclusions. It's where you connect the data to the hypothesis and explain why you observed the results you did.
- Interpretation of Results: Explain what the data means in relation to the hypothesis. "The results support the hypothesis that increasing the concentration of acid accelerates the corrosion rate of steel. The observed pH changes correlated with the increase in corrosion."
- Comparison to Expected Results: Compare your results to what you expected. "The results were consistent with the expected rate of corrosion, as indicated by the observed pH changes."
- Potential Sources of Error: Discuss any potential sources of error that may have affected the results. "Possible sources of error include slight variations in sample size and the influence of temperature."
- Limitations: Acknowledge any limitations of the experiment. "This experiment was conducted under controlled laboratory conditions and may not accurately reflect real-world conditions."
Section 5: Conclusion – Summarizing the Findings
The conclusion summarizes the key findings of the experiment and reiterates the main conclusions drawn. It should be concise and leave the reader with a clear understanding of the experiment's significance.
- Restate the Objective: Briefly remind the reader of the experiment's objective.
- Summarize Key Findings: Briefly reiterate the most important results.
- Implications: Discuss the broader implications of the findings. "These results demonstrate the importance of controlling factors such as acid concentration when studying corrosion."
- Future Research: Suggest potential avenues for future research. "Further research could investigate the effects of different types of acid on steel corrosion."
Section 6: References – Acknowledging Sources
This section lists all sources cited in the report, following a consistent citation style (e.g., APA, MLA). It's crucial for academic integrity and allows readers to verify the information presented.

Section 7: Appendices (Optional) – Supporting Materials
This section can include supplementary materials such as raw data, detailed calculations, or additional figures/tables.
Conclusion
The engineering lab report template is a fundamental tool for scientific inquiry. By adhering to a structured approach, researchers can ensure the clarity, reproducibility, and validity of their work. The consistent application of this template, combined with thoughtful analysis and clear communication, significantly enhances the quality and impact of laboratory investigations. Ultimately, a well-crafted report not only documents the experiment but also contributes to the advancement of knowledge. Remember, a robust lab report is an investment in the credibility and success of your work. Utilizing this template effectively will empower you to confidently present your findings and contribute meaningfully to the field. The principles outlined in this article provide a solid foundation for building effective lab reports – a cornerstone of scientific practice. Further refinement and adaptation of this template will be crucial as research methodologies evolve.
0 Response to "Engineering Lab Report Template"
Posting Komentar