
Effective communication is the backbone of any successful software development project, and nowhere is this more critical than in the process of identifying and resolving defects. Without a clear and consistent method for reporting issues, development teams can quickly become overwhelmed, project managers lose visibility into the health of the application, and stakeholders are left in the dark. A well-structured Bug Summary Report Template provides the framework needed to transform chaotic bug data into actionable insights, ensuring everyone from the QA tester to the CEO has a clear understanding of the product's quality and stability.
This standardized approach to reporting moves beyond individual bug tickets to present a high-level, strategic overview. It aggregates data, highlights trends, and pinpoints critical areas that require immediate attention. Think of it as the executive summary for your project's health. While a single bug report details the "what" and "how" of one specific problem, a summary report answers the bigger questions: Are we getting better? Where are our biggest risks? Are we on track for our release date?
Implementing a consistent bug summary process is a game-changer for team alignment. It creates a single source of truth that bridges the communication gap between technical and non-technical stakeholders. Developers can see priority areas, QA teams can track the impact of their testing efforts, and leadership can make informed, data-driven decisions about resource allocation, timelines, and release readiness. This prevents misunderstandings and ensures that the entire team is working towards the same goal: shipping a high-quality, reliable product.
In this comprehensive guide, we will break down everything you need to know about creating and utilizing an effective bug summary report. We'll explore the essential components that make a report truly valuable, provide a versatile and ready-to-use template, and share best practices for integrating this process into your workflow. By the end, you'll be equipped to turn raw bug data into a powerful tool for communication and project management.
What Exactly is a Bug Summary Report?
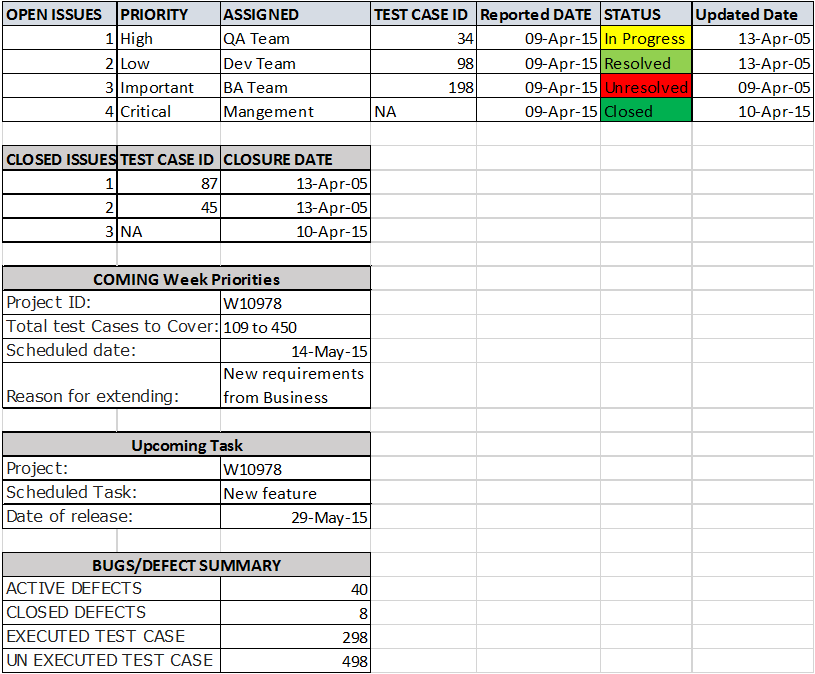
A bug summary report is a high-level document that aggregates and presents data about software defects over a specific period or for a particular project scope. Its primary purpose is not to detail every single bug but to provide a consolidated overview of the software's overall health and stability. It synthesizes information from a bug tracking system to give stakeholders a clear, digestible snapshot of the current situation, trends, and potential risks.
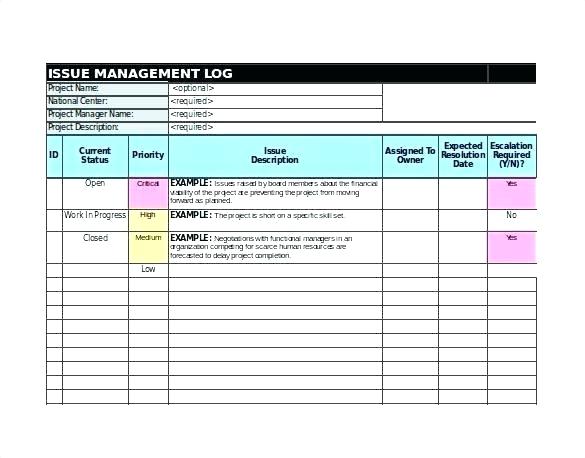
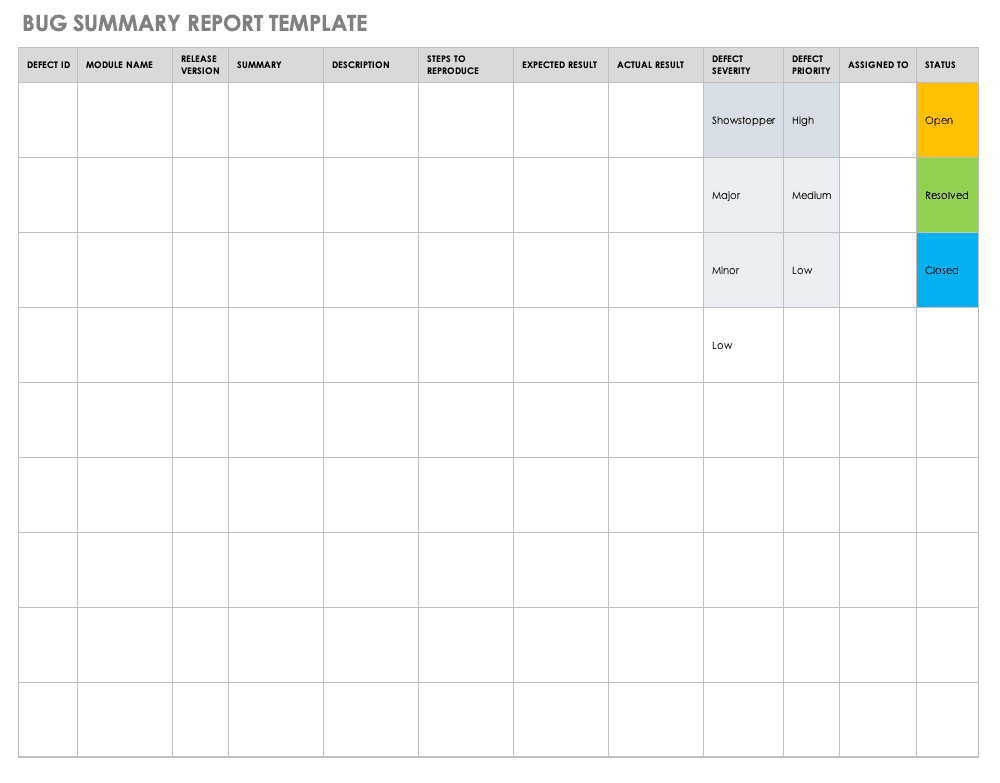
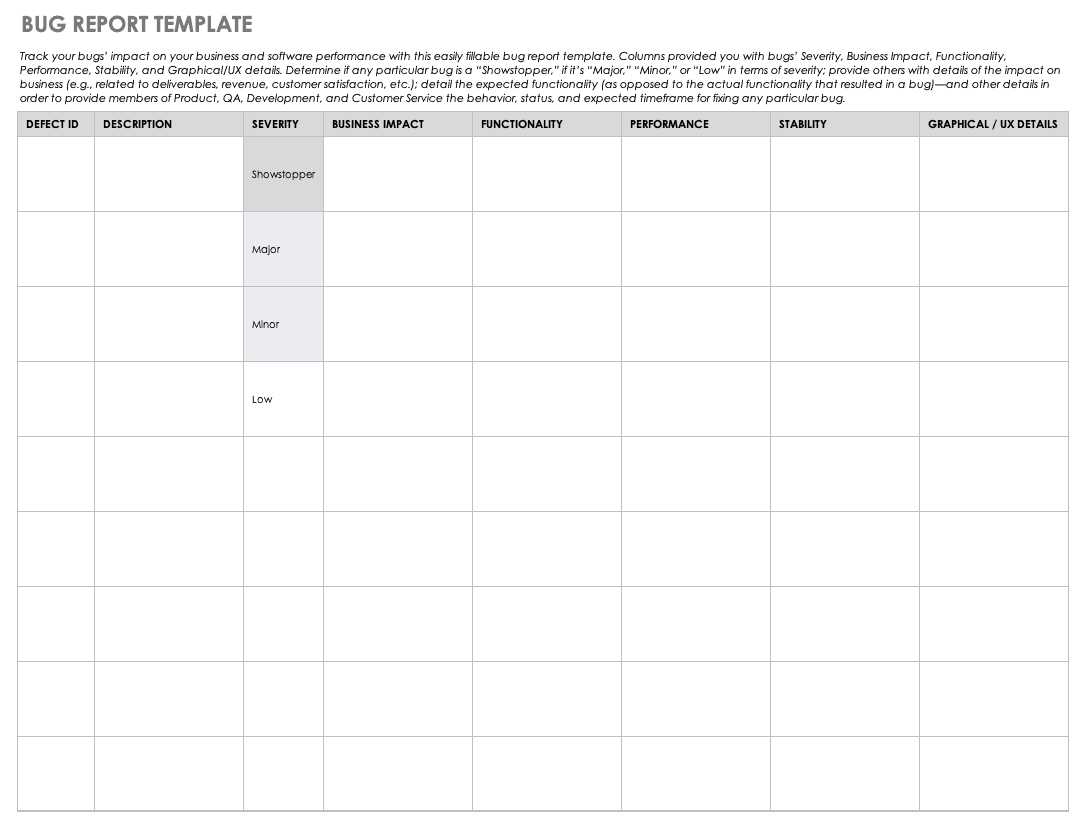
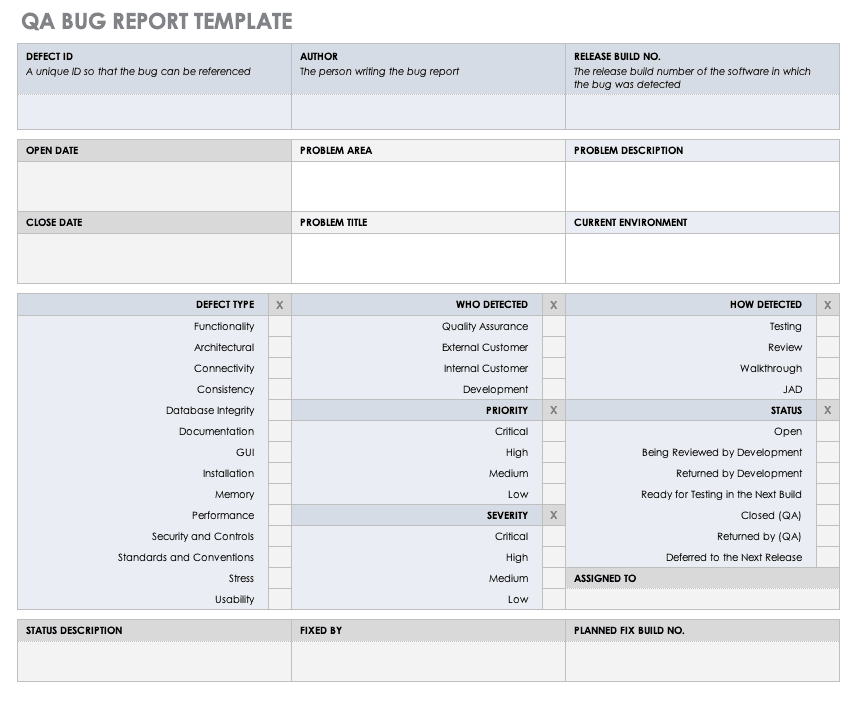
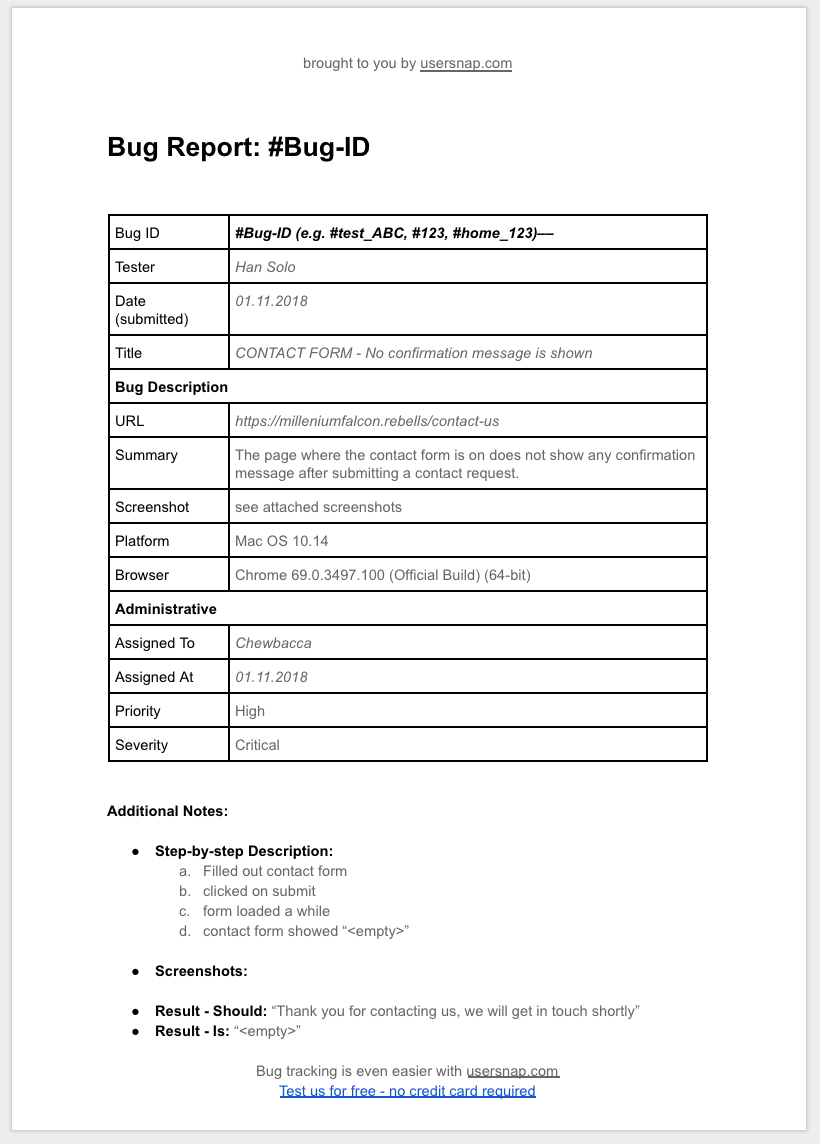
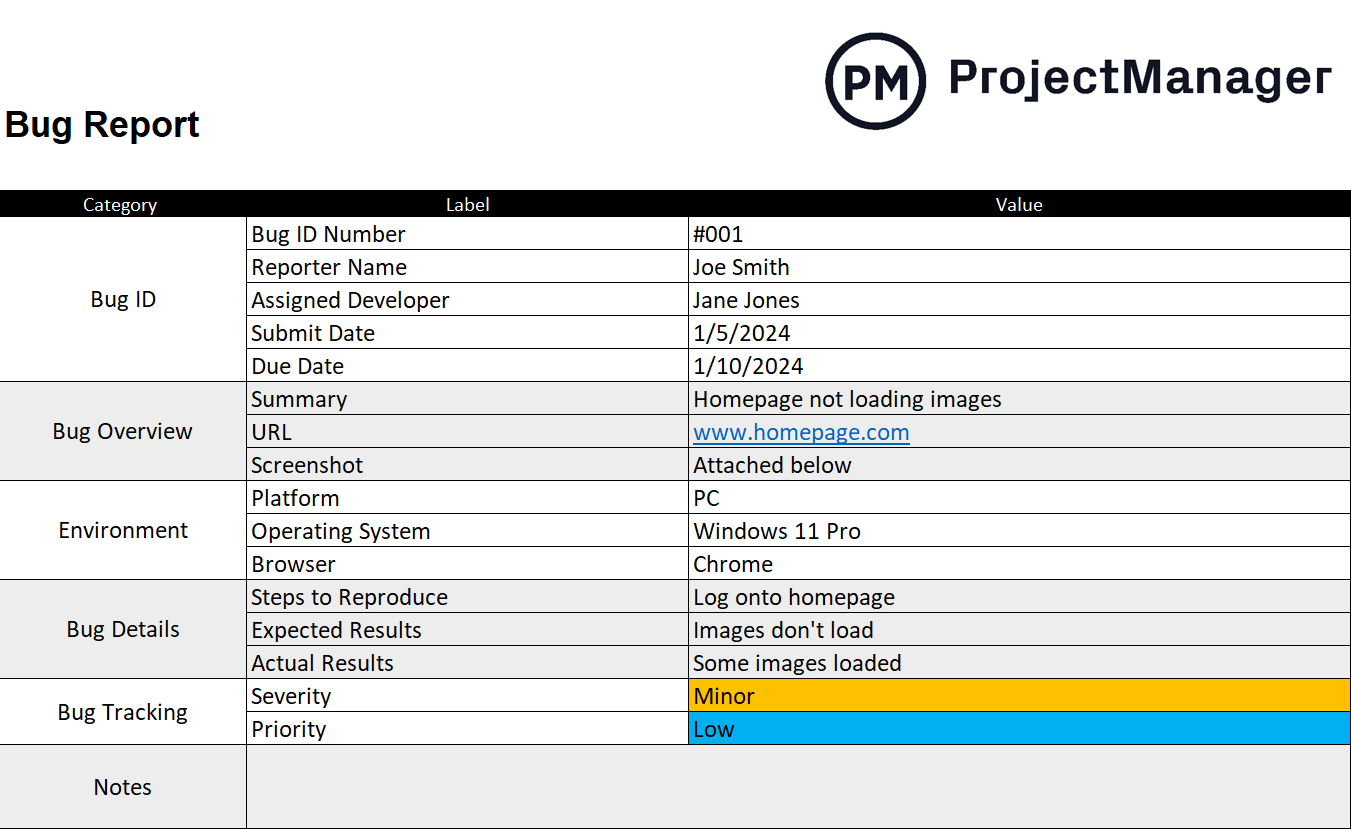
The key difference between a bug summary report and an individual bug report lies in their scope and audience. An individual bug report is a granular, technical document created by a tester or user. It contains specific details needed for a developer to reproduce and fix a single issue, such as steps to reproduce, actual vs. expected results, and environment details. Its audience is primarily the development and QA teams.
In contrast, a bug summary report is strategic and analytical. It looks at the entire collection of bug reports. It might cover a specific sprint, a release candidate, or a calendar month. The audience is much broader, often including project managers, product owners, engineering leads, and even executive leadership. This report answers questions like, "How many critical bugs are still open before the release?" or "Are we finding and fixing bugs faster than we were last month?" It focuses on metrics, trends, and the overall impact of bugs on the project timeline and user experience.
The Core Components of an Effective Bug Summary Report
A truly useful bug summary report is more than just a list of bugs. It tells a story with data. To be effective, it should include several key components that provide context, highlight critical information, and guide decision-making.
Report Metadata
This is the basic identifying information that gives context to the report. It ensures anyone who reads it, now or in the future, understands its scope and origin.
- Report ID: A unique identifier for easy reference (e.g., BSR-Q4-2023).
- Project Name: The software or application the report pertains to.
- Reporting Period: The specific timeframe the data covers (e.g., Sprint 24, October 1-15, 2023).
- Report Date: The date the report was generated.
- Author/Prepared By: The name of the person or team who created the report.
Executive Summary
This is arguably the most important section for senior stakeholders. It's a brief, non-technical paragraph that summarizes the key findings and overall status. It should concisely state the most critical information, such as a reduction in blocker bugs, a new risk identified in a key feature, or the overall readiness for a release.
Key Metrics and KPIs
This section provides a quantitative snapshot of the project's health. The metrics should be consistent across reports to allow for easy trend analysis.
- Bugs Opened vs. Closed: A fundamental metric showing the flow of work. Are you closing more bugs than are being discovered?
- Total Open Bugs: The current backlog of unresolved issues.
- Bug Distribution by Priority/Severity: A breakdown of how many open bugs are classified as Blocker, Critical, Major, Minor, etc. This helps prioritize efforts.
- Bug Distribution by Status: A count of bugs in each stage of the workflow (e.g., New, In Progress, Ready for Retest, Closed).
- Bug Aging: The average time a bug remains open. A high or increasing average age can indicate bottlenecks in the development process.
- Bug Density: The number of bugs found per module or feature, which can help identify problematic areas of the codebase.
Trend Analysis
Data is most powerful when viewed over time. This section uses historical data to show progress and identify patterns. Visualizations like charts and graphs are extremely effective here.

- Bug Discovery Rate: A line chart showing the number of new bugs found per week or sprint.
- Bug Resolution Rate: A chart showing the number of bugs closed over the same period.
- Backlog Trend: A graph illustrating whether the total number of open bugs is increasing, decreasing, or remaining stable.
Risks and Recommendations
Based on the data, this section provides forward-looking analysis. It's where the report becomes actionable.

- Risks: Clearly state any potential threats to the project timeline, budget, or quality based on the bug data (e.g., "The high number of open critical bugs in the payment module poses a significant risk to the planned release date.").
- Recommendations: Suggest concrete actions to mitigate the identified risks (e.g., "Allocate two additional developers to the payment module to address critical bugs before the code freeze.").
A Versatile Bug Summary Report Template You Can Use
Here is a practical and comprehensive template that you can adapt for your projects. This structure incorporates all the essential components discussed above and is designed for clarity and impact. You can use this in a document, an email, or a presentation slide.
[Your Project Name] - Bug Summary Report
Report ID: [e.g., BSR-2023-10-26]
Reporting Period: [e.g., Sprint 22: Oct 16, 2023 - Oct 27, 2023]
Report Date: [e.g., October 27, 2023]
Prepared By: [Your Name/Team Name]
1. Executive Summary
During this reporting period, the team made significant progress in stabilizing the upcoming V2.1 release. The total number of open critical bugs was reduced from 10 to 4. However, testing of the new third-party API integration has revealed a cluster of 8 new high-priority issues that pose a moderate risk to the launch timeline. The immediate focus for the next week will be on resolving these API-related defects.
2. Key Metrics Overview
| Metric | Current Period | Previous Period | Trend |
|---|---|---|---|
| Total Open Bugs | 125 | 140 | ▼ |
| New Bugs Found | 35 | 42 | ▼ |
| Bugs Closed | 50 | 38 | ▲ |
| Average Bug Age (Days) | 12 | 14 | ▼ |
3. Bug Distribution by Priority
- Blocker:
[e.g., 1] - Critical:
[e.g., 4] - High:
[e.g., 28] - Medium:
[e.g., 60] - Low:
[e.g., 32]
(Optional: Insert a bar or pie chart here for visual representation.)
4. Bug Distribution by Status
- New:
[e.g., 35] - In Progress:
[e.g., 20] - Ready for Retest:
[e.g., 15] - Closed:
[e.g., 50] - Rejected:
[e.g., 5]
5. Highlights: Critical & High-Priority Issues
| Bug ID | Summary | Priority | Status | Assignee |
|---|---|---|---|---|
[e.g., PROJ-123] | User cannot complete checkout with PayPal | Blocker | In Progress | [Dev Name] |
[e.g., PROJ-145] | App crashes on launch for Android 13 | Critical | In Progress | [Dev Name] |
[e.g., PROJ-150] | Incorrect pricing displayed after applying discount | High | New | Unassigned |
6. Trend Analysis & Observations
- The rate of new bug discovery has decreased by 15% compared to the previous sprint, indicating improved code stability in core features.
- The 'User Profile' module continues to be a hotspot for new bugs, accounting for 30% of all high-priority issues discovered this period.
- The bug fix rate has increased by 31%, showing improved developer productivity and focus.
(Optional: Insert a line graph showing Open vs. Closed bugs over the last 4 sprints.)
7. Risks & Blockers
- Risk 1: The unresolved Blocker (
PROJ-123) is a direct threat to the planned release on Nov 5th. A resolution is required by EOD Oct 30th to stay on track. - Risk 2: The QA team's bandwidth is at maximum capacity, which may slow down the re-testing of fixed bugs and create a bottleneck.
8. Recommendations
- Recommendation 1: Form a dedicated "tiger team" of two developers to swarm on
PROJ-123with the goal of resolving it within the next 48 hours. - Recommendation 2: De-prioritize testing of low-risk, non-critical features for the next sprint to free up QA resources for regression testing of the payment module.
Best Practices for Creating and Using a Bug Summary Report
Creating the report is only half the battle. How you create and use it determines its ultimate value.
- Know Your Audience: Tailor the level of detail. Executives and clients need the executive summary and key metrics. Development leads and project managers will care more about the detailed breakdown and trend analysis.
- Automate Data Collection: Manually counting bugs is tedious and prone to error. Leverage the built-in reporting and dashboard features of your bug tracking tool (like Jira or Azure DevOps) to pull the raw numbers automatically. Your time should be spent on analysis, not counting.
- Consistency is Crucial: Use the same template, metrics, and definitions in every report. This consistency is what makes trend analysis meaningful and allows you to track progress accurately over time.
- Visualize Your Data: Humans are visual creatures. Charts and graphs are far more effective at conveying trends and distributions than dense tables of numbers. Use bar charts for distribution (e.g., by priority) and line charts for trends over time (e.g., open vs. closed bugs).
- Focus on Impact, Not Just Numbers: Don't just state that there are 10 critical bugs. Explain what that means. For example, "The 10 open critical bugs are preventing 80% of our beta testers from completing the core user journey."
- Make It Actionable: A report that doesn't lead to action is a waste of time. Every report should conclude with clear risks and concrete recommendations. Use the report as a centerpiece for discussion in sprint reviews or planning meetings to decide on the next steps.
- Establish a Regular Cadence: Whether it's weekly, bi-weekly, or at the end of each sprint, create a predictable schedule for the report. This builds it into the team's rhythm and makes it an expected and valued part of the development lifecycle.
Tools for Generating Your Bug Summary Report Template
Modern software development tools make generating the data for your Bug Summary Report Template easier than ever. Most of the heavy lifting can be automated, allowing you to focus on the crucial analysis and summary.
Integrated Project Management Tools
These all-in-one platforms are often the primary source for bug data and come with powerful reporting capabilities.

- Jira: As the industry leader, Jira offers highly customizable dashboards. You can create gadgets to display pie charts of bug priorities, tables of recently created issues, and line charts showing created vs. resolved trends. Using Jira Query Language (JQL), you can create precise filters to power these gadgets and pull exactly the data you need.
- Azure DevOps (ADO): ADO provides robust querying and charting tools directly within the platform. You can build complex queries to segment bug data and then generate various charts (bar, column, pie, trend) that can be pinned to a team dashboard for constant visibility.
- ClickUp, Asana, Monday.com: While more general-purpose project management tools, they often have customizable fields and dashboard features that can be configured for effective bug tracking and summary reporting, especially for smaller projects.
Dedicated Bug Tracking Tools
These tools are specifically designed for defect management and often have specialized reporting features.
- Bugzilla: A veteran open-source bug tracker, Bugzilla offers powerful reporting capabilities, including graphical reports and the ability to schedule and email reports automatically.
- MantisBT: Another popular open-source option, MantisBT provides summaries, changelogs, and roadmaps based on the bug data entered into the system.
Business Intelligence (BI) Tools
For the most advanced and customized analysis, you can connect your bug tracking data to a dedicated BI tool.
- Power BI and Tableau: By exporting data from Jira or ADO (often via an API or CSV export), you can use these tools to create highly interactive and detailed dashboards. This allows you to cross-reference bug data with other project metrics for deeper insights, such as correlating bug density with code churn.
Common Pitfalls to Avoid in Bug Reporting
Even with the best template and tools, a few common mistakes can undermine the effectiveness of your bug summary reports.
- Focusing on Vanity Metrics: Be wary of metrics that look good but don't reflect true progress. For instance, a high number of closed bugs might seem great, but if they are all trivial while critical bugs are ignored, the metric is misleading.
- Creating Information Overload: The purpose of a summary is to be concise. Don't include every single open bug. Highlight the most critical issues and focus on the trends and overall picture. Link to the full bug tracker for those who want to dig deeper.
- Lacking Context: Numbers without context are meaningless. If there's a sudden spike in new bugs, explain why. Was it due to the release of a large new feature? Or did the QA team start a new cycle of exploratory testing? Providing this context turns data into information.
- Using it as a Blame Tool: The report should be a tool for collaboration and improvement, not for pointing fingers. A high number of bugs in a certain module should trigger a discussion about code complexity or testing strategy, not blame the developer who worked on it.
- Ignoring Data Hygiene: The report is only as good as the data in your bug tracking system. If your team isn't diligent about setting the correct priority, updating statuses promptly, and filling in necessary fields, your summary report will be inaccurate and untrustworthy. Emphasize the importance of "garbage in, garbage out" to your team.
Conclusion
A Bug Summary Report Template is far more than a simple administrative document; it is a strategic communication and decision-making tool. By transforming raw, granular bug data into a high-level, digestible overview, it bridges the gap between technical teams and business stakeholders. It provides a clear, data-driven picture of a project's health, highlights critical risks before they escalate, and allows teams to celebrate measurable improvements in product quality.
The key to its success lies in consistency, clarity, and a focus on actionable insights. By adopting a standardized template, automating data collection with modern tools, and adhering to best practices, you can make bug reporting a powerful catalyst for positive change. This process fosters alignment, builds confidence among stakeholders, and ultimately guides your entire team toward the shared goal of delivering an exceptional and reliable product. Start by implementing the template and practices outlined here, and watch as your bug management process evolves from a reactive chore into a proactive driver of quality.
0 Response to "Bug Summary Report Template"
Posting Komentar