
A blank stem and leaf plot template is an invaluable tool for organizing and visualizing numerical data. It provides a simple yet effective method for displaying the distribution of a dataset, making it easier to identify patterns, outliers, and the overall shape of the data. Whether you're a student learning statistics, a researcher analyzing results, or a professional presenting data, a stem and leaf plot can offer a clear and concise representation of your information.
Stem and leaf plots are particularly useful because they retain the original data while simultaneously grouping it for analysis. Unlike histograms, which group data into bins, stem and leaf plots show each individual data point. This allows for a more detailed understanding of the data's spread and central tendency. Furthermore, creating a stem and leaf plot is relatively straightforward, requiring only basic arithmetic and organizational skills.

This article will delve into the intricacies of stem and leaf plots, explaining how they work, their advantages and disadvantages, and how to effectively utilize a blank template to create your own insightful visualizations. We will also explore different variations of stem and leaf plots and practical applications across various fields. By the end of this guide, you will have a comprehensive understanding of how to leverage this powerful tool for data analysis and presentation.

What is a Stem and Leaf Plot?
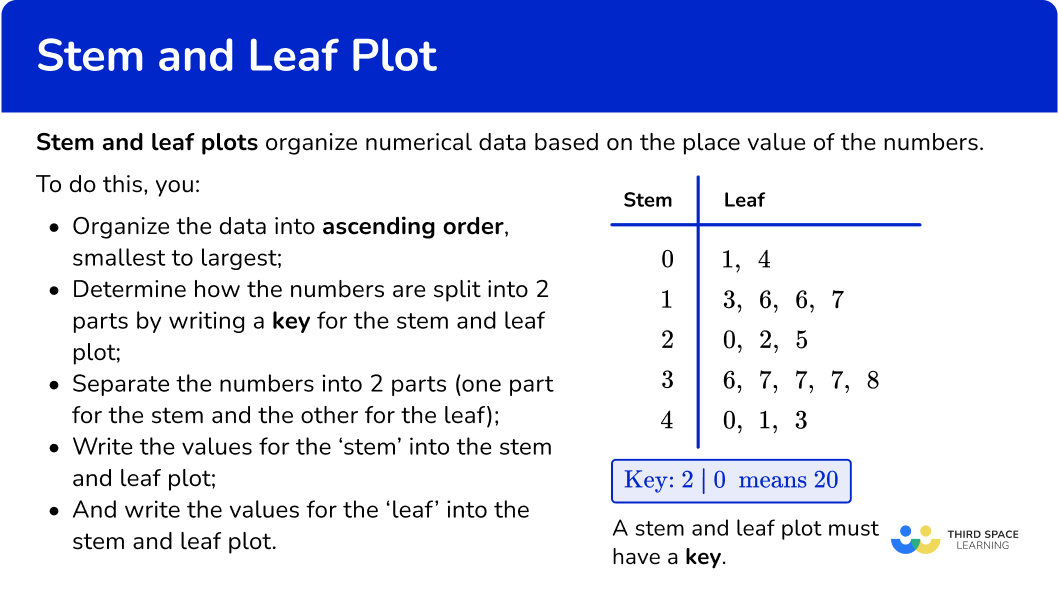
A stem and leaf plot, also known as a stemplot, is a graphical representation of quantitative data that separates each data value into two parts: a stem and a leaf. The stem typically consists of the leading digit(s) of the data value, while the leaf represents the trailing digit(s). The stems are listed in a vertical column, and the leaves are listed horizontally next to their corresponding stems.
Components of a Stem and Leaf Plot
The stem and leaf plot comprises two essential components: the stem and the leaf. Understanding these components is crucial for interpreting and creating accurate plots.
Stem: The stem represents the leading digit or digits of the data value. For example, if a data value is 47, the stem would be 4. If the data value is 123, the stem could be 12. The choice of which digits to use as the stem depends on the range of the data and the desired level of detail.

Leaf: The leaf represents the trailing digit of the data value. Using the same example as above, if a data value is 47, the leaf would be 7. If the data value is 123 and the stem is 12, the leaf would be 3. Leaves are typically arranged in ascending order next to their corresponding stems.
How to Create a Stem and Leaf Plot
Creating a stem and leaf plot involves a few simple steps:
Identify the Range of Data: Determine the minimum and maximum values in your dataset. This will help you determine the appropriate stems to use.
Choose the Stems: Select the leading digit(s) that will serve as the stems. The stems should cover the entire range of the data.
List the Stems: Write the stems in a vertical column, in ascending order, from the smallest to the largest.

Add the Leaves: For each data value, identify the corresponding stem and add the leaf (trailing digit) next to that stem.

Order the Leaves: Arrange the leaves in ascending order from left to right for each stem.

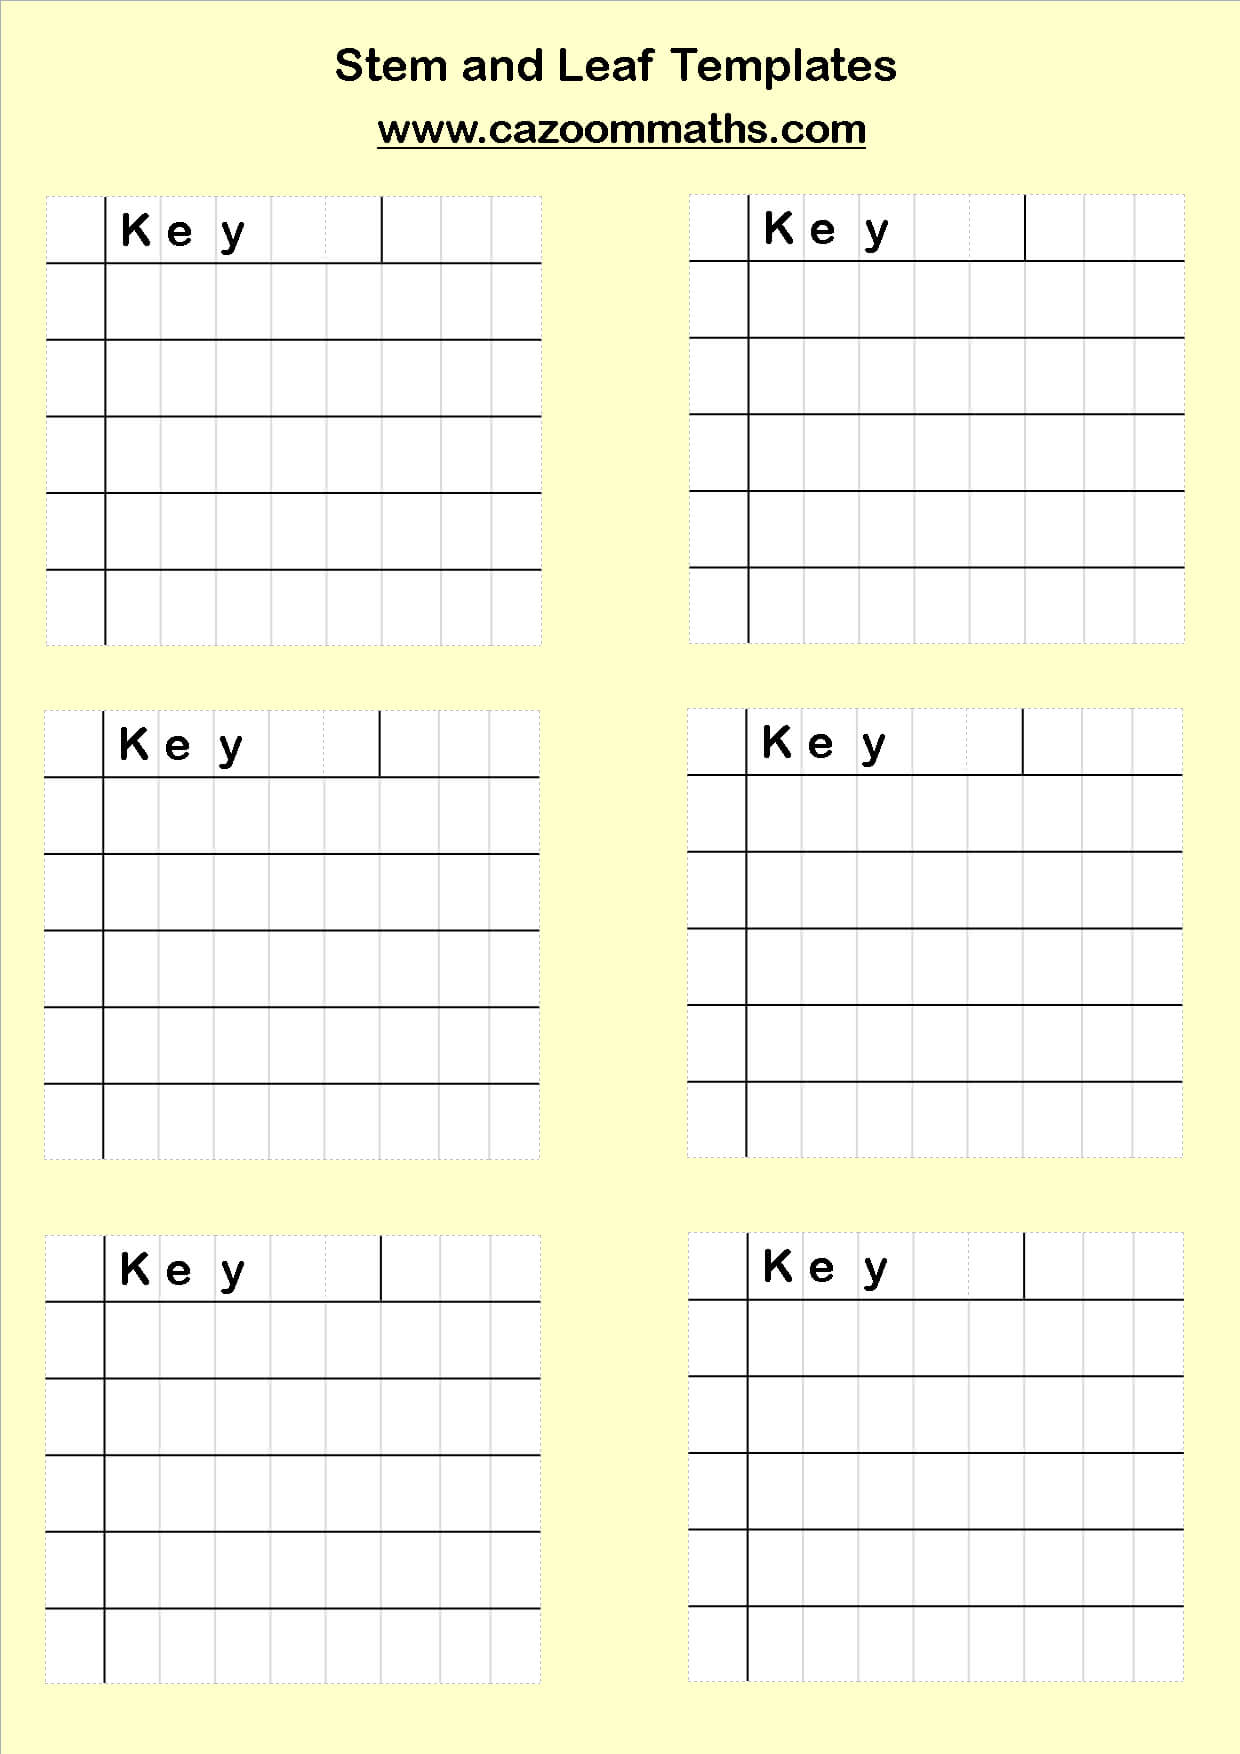
Include a Key: Provide a key that explains what the stems and leaves represent. For example, "4 | 7 represents 47."


Advantages and Disadvantages of Using Stem and Leaf Plots
Stem and leaf plots offer several advantages over other data visualization methods, but they also have some limitations.

Advantages
Preserves Original Data: Unlike histograms, stem and leaf plots retain the original data values, allowing for a more detailed analysis.
Simple to Create: Stem and leaf plots are relatively easy to create by hand, requiring only basic arithmetic and organizational skills. A blank stem and leaf plot template can simplify this process even further.
Provides Shape of Distribution: Stem and leaf plots visually represent the shape of the data distribution, making it easier to identify patterns, skewness, and outliers.
Useful for Small to Medium Datasets: Stem and leaf plots are particularly effective for visualizing small to medium-sized datasets (typically fewer than 100 data points).
Disadvantages
Not Suitable for Large Datasets: Stem and leaf plots can become cumbersome and difficult to read with large datasets, as the leaves can become too numerous.
Limited Flexibility: Stem and leaf plots are not as flexible as other data visualization methods, such as histograms or scatter plots, in terms of customization and display options.
Can Be Misleading with Rounded Data: If the data is rounded, the stem and leaf plot may not accurately represent the true distribution.
How to Use a Blank Stem And Leaf Plot Template
A blank stem and leaf plot template provides a pre-formatted structure for organizing your data. Using a template can save time and ensure consistency in your plots.
Steps for Using a Blank Template
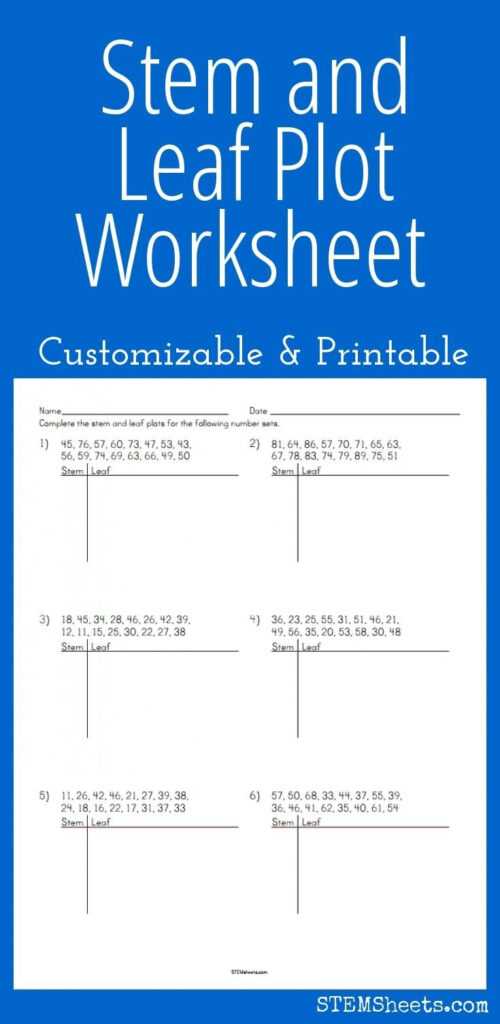
Obtain a Template: You can find blank stem and leaf plot templates online or create your own using a word processor or spreadsheet program.
Identify the Range of Data: Determine the minimum and maximum values in your dataset.
Determine Stems: Based on the range of data, decide on appropriate stems for your plot.
Populate the Stems: Write the stems in the designated column of the template, in ascending order.
Add the Leaves: For each data value, identify the corresponding stem and write the leaf in the appropriate row of the template.
Order the Leaves: Arrange the leaves in ascending order within each row.
Add a Key: Include a key that explains what the stems and leaves represent.
Tips for Effective Template Use
Choose the Right Template: Select a template that is appropriate for the size and type of your data.
Use a Consistent Format: Maintain a consistent format throughout the plot, including the spacing and alignment of the stems and leaves.
Label Clearly: Clearly label the stems and leaves, and provide a descriptive title for the plot.
Double-Check Your Work: Before finalizing the plot, carefully double-check your work to ensure accuracy.
Variations of Stem and Leaf Plots
While the basic stem and leaf plot is a valuable tool, several variations can be used to enhance its effectiveness and adapt it to different types of data.
Back-to-Back Stem and Leaf Plot
A back-to-back stem and leaf plot, also known as a comparative stem and leaf plot, is used to compare two related datasets. The stems are placed in the center of the plot, with the leaves for one dataset extending to the left and the leaves for the other dataset extending to the right. This allows for a direct visual comparison of the distributions of the two datasets.
Truncated Stem and Leaf Plot
In a truncated stem and leaf plot, data values are truncated (i.e., rounded down) to simplify the plot. This can be useful when dealing with data that has many digits or when a less precise representation is sufficient. However, it's important to note that truncation can distort the true distribution of the data.
Split Stem and Leaf Plot
A split stem and leaf plot is used when there are many data values with the same stem. In this variation, each stem is split into multiple rows, with each row representing a different range of leaf values. For example, the stem "4" might be split into "4*" (for leaves 0-4) and "4." (for leaves 5-9). This helps to spread out the data and improve the readability of the plot.
Practical Applications of Stem and Leaf Plots
Stem and leaf plots have diverse applications across various fields, including:
Education
In education, stem and leaf plots are used to teach students about data analysis and visualization. They provide a hands-on way to explore concepts such as distribution, central tendency, and outliers. Teachers can use a blank stem and leaf plot template to help students practice creating and interpreting plots.
Business and Finance
In business and finance, stem and leaf plots can be used to analyze sales data, stock prices, or other financial metrics. They can help identify trends, patterns, and anomalies in the data.
Science and Engineering
In science and engineering, stem and leaf plots can be used to analyze experimental data, monitor process performance, or assess the reliability of equipment. They can help identify sources of variability and improve the quality of products and processes.
Healthcare
In healthcare, stem and leaf plots can be used to analyze patient data, track disease trends, or evaluate the effectiveness of treatments. They can help identify risk factors and improve patient outcomes.
Example: Creating a Stem and Leaf Plot with a Template
Let's say we have the following dataset representing the scores of 20 students on a recent quiz:
62, 75, 81, 93, 58, 77, 85, 68, 72, 90, 65, 88, 79, 55, 95, 70, 83, 60, 74, 86
Range of Data: The minimum value is 55, and the maximum value is 95.
Stems: We'll use the tens digit as the stem: 5, 6, 7, 8, 9.
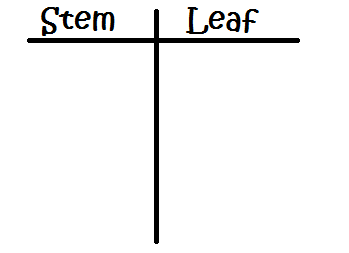
Blank Template:
| Stem | Leaf |
|---|---|
| 5 | |
| 6 | |
| 7 | |
| 8 | |
| 9 |
- Adding Leaves (Unordered):
| Stem | Leaf |
|---|---|
| 5 | 8 5 |
| 6 | 2 5 8 0 |
| 7 | 5 7 2 9 0 4 |
| 8 | 1 5 8 3 6 |
| 9 | 3 0 5 |
- Ordering Leaves:
| Stem | Leaf |
|---|---|
| 5 | 5 8 |
| 6 | 0 2 5 8 |
| 7 | 0 2 4 5 7 9 |
| 8 | 1 3 5 6 8 |
| 9 | 0 3 5 |
- Key: 5 | 5 represents a score of 55.
This completed stem and leaf plot provides a clear visualization of the distribution of quiz scores. We can easily see that most scores fall in the 70s and 80s, with a few scores in the 50s and 90s.
Conclusion
The blank stem and leaf plot template is a powerful and versatile tool for data analysis and visualization. It offers a simple yet effective way to display the distribution of a dataset, making it easier to identify patterns, outliers, and the overall shape of the data. While stem and leaf plots have some limitations, their advantages make them a valuable addition to any data analyst's toolkit. By understanding how to create and interpret stem and leaf plots, you can gain valuable insights from your data and communicate your findings effectively. From education to business and beyond, the stem and leaf plot remains a relevant and insightful method for understanding numerical information.
0 Response to "Blank Stem And Leaf Plot Template"
Posting Komentar